Salesforce Lightning Dashboards
Customize this Salesforce Lightning training to give your revenue team the help they need as they're creating dashboards, reporting, and more.
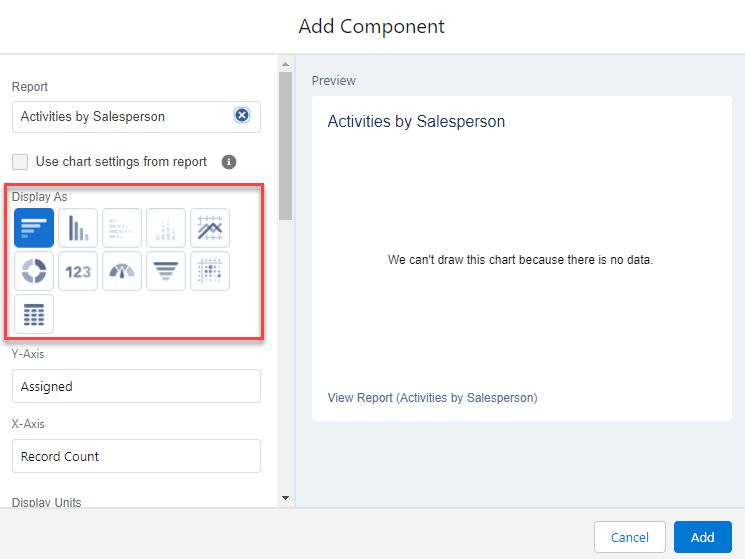
1. Dashboard Component Types in Salesforce Lightning
When creating or editing a Component in Salesforce Lightning, you have 11 chart options to choose from:
1. Horizontal Bar Chart
- You need at least one Grouping on the Report.

2. Vertical Bar Chart
- You need at least one Grouping on the Report.

3. Stacked Horizontal Bar Chart
- You need at least two Groupings on the Report.
- Choose to stack to 100% instead of by value.

4. Stacked Vertical Bar Chart
- You need at least two Groupings on the Report.
- Choose to stack to 100% instead of by value.

5. Line Chart
- Display data over time.
- Display cumulative totals

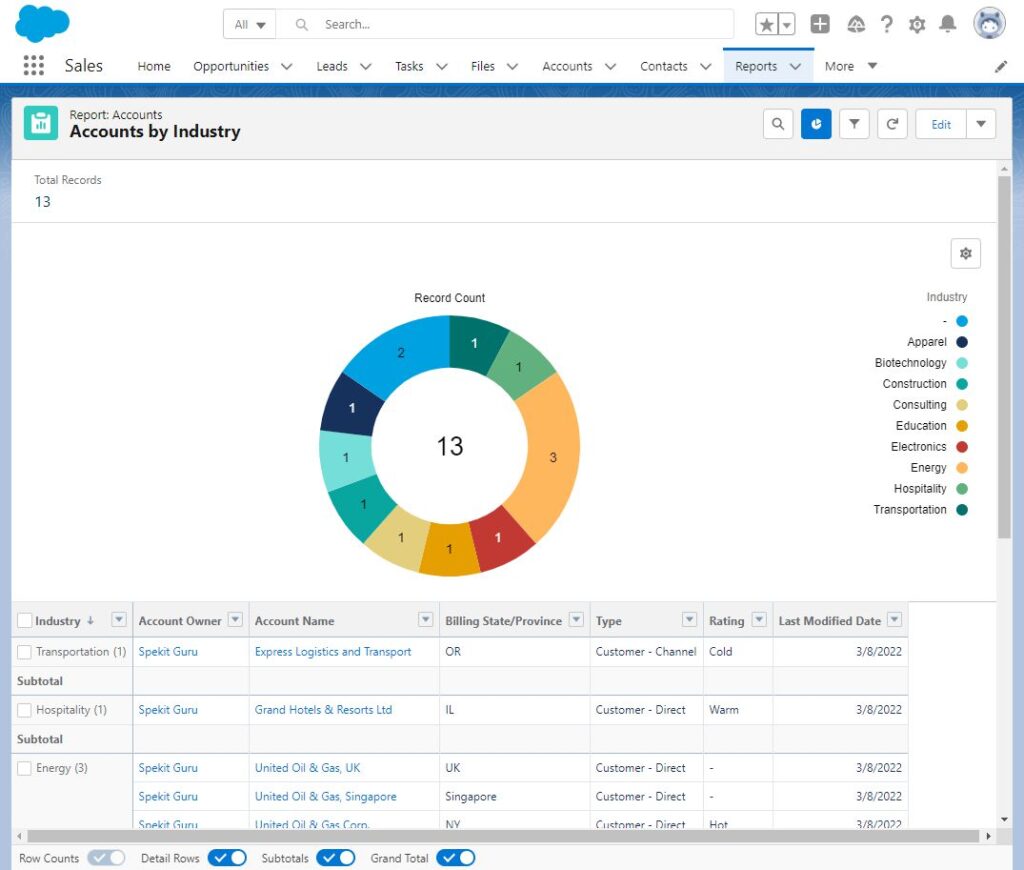
6. Donut Chart
- A pie chart with a hole in the center for the value total of all wedges.
- Display value and/or percent.
- Combine Small Groups of wedges into an “Other” wedge.

7. Metric Chart
- Display a single number/currency.
- Configure a range where the color of the value changes when the value does.

8. Gauge Chart

9. Funnel Chart
- Use to group a linear process like Opportunity Stage.
- Display value and/or percent.
- Combine Small Groups into an “Other” part of the Funnel.

10. Scatter Chart
- One or two Groupings and their measured values.

11. Lightning Table
- Mimics a Grouped report with Detail Rows toggled off.
- Add Conditional Highlighting.

2. Dashboard Components in Salesforce Lightning
Each chart on a Dashboard is called a Dashboard Component. They are visual representations of existing reports and can be dragged and dropped to display different data in various sizes and orders.
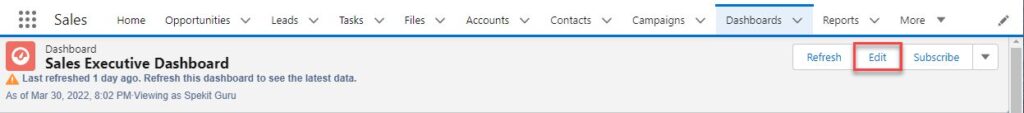
1. Navigate to a dashboard.
2. Click Edit.
3. Click + Component.
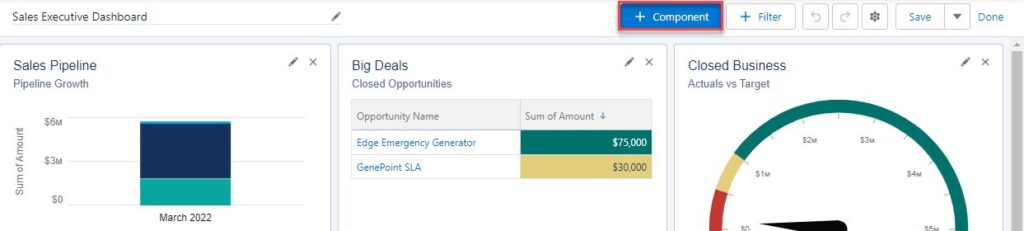
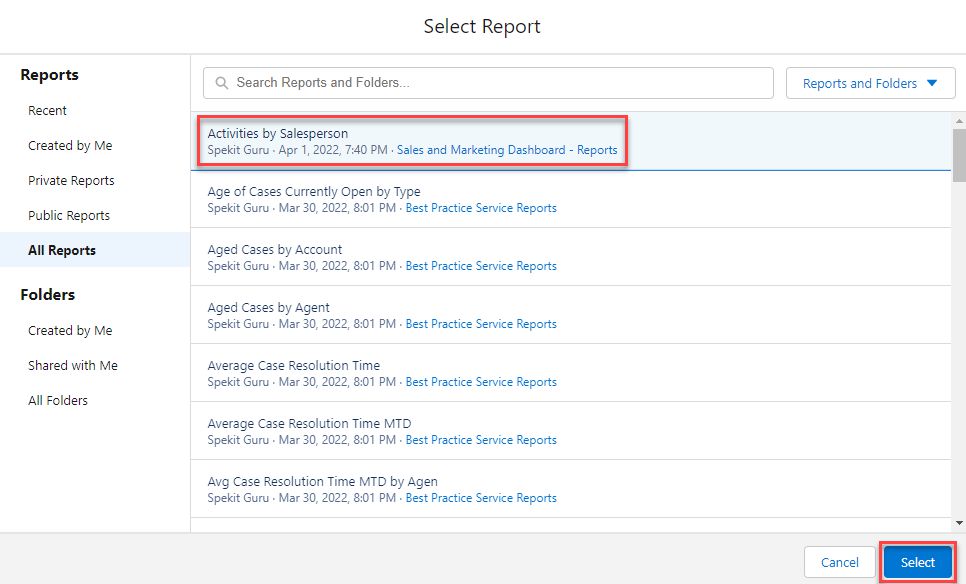
4. Select a Report.
5. Click Select.
4. Click Delete.
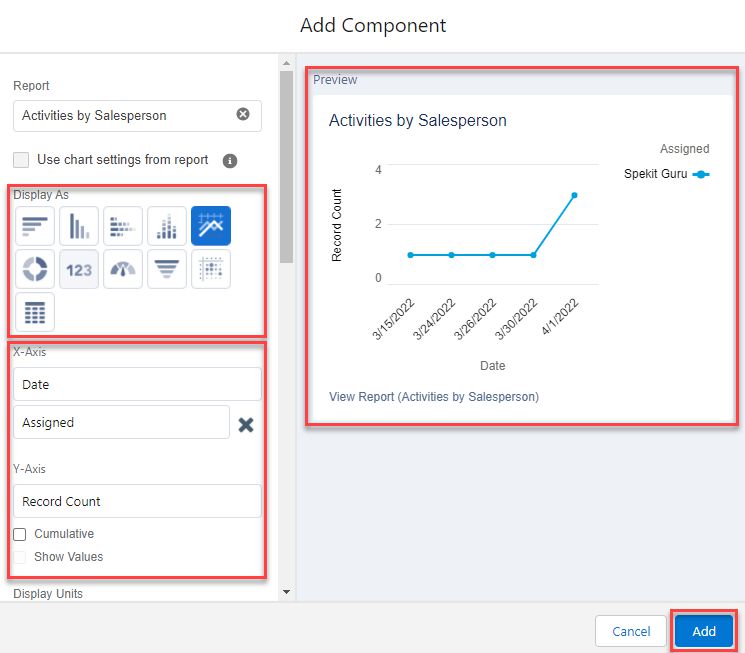
6. Choose a Component Type.
- Search 🔍 for “Dashboard Component Types” to learn more.
7. Configure the Component display.
8. Click Add.
Edit Components
1. Navigate to a Dashboard.
2. Click Edit.
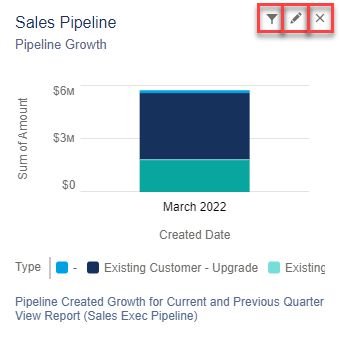
3. Click the Funnel icon to set what field is used to filter that component for the Dashboard Filters.
4. Click the ✏️ icon to Edit the Component.
5. Click the ❌ icon to Delete the Filter.
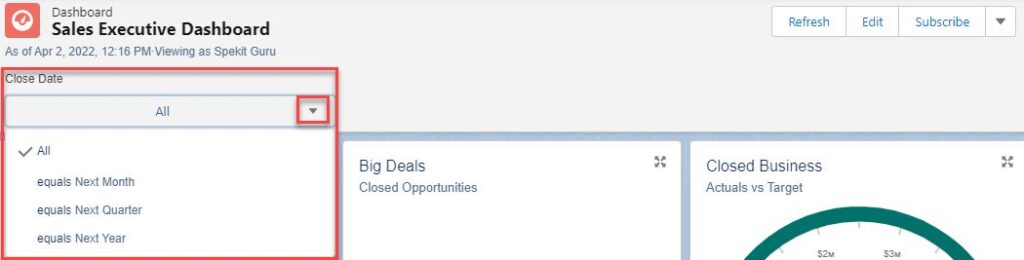
3. Dashboard Filters in Salesforce Lightning
There may be certain fields where data needs to be seen across the board and also per field value
Examples:
- Case Priority
- Account Region
- Opportunity Owner
Benefits
With Dashboard Filters, you create one dashboard and one set of source reports and add a dashboard filter to see the various changes at the click of a button.
- 1 set of source reports, 1 dashboard, and 1 Dashboard Filter with options of Global, Americas, APAC, EMEA
- VS
- 4 sets of source reports and 4 dashboards – one each for Global, Americas, APAC, EMEA
Allotment
Add up to 3 filters per Dashboard.
Examples:
Create a Filter
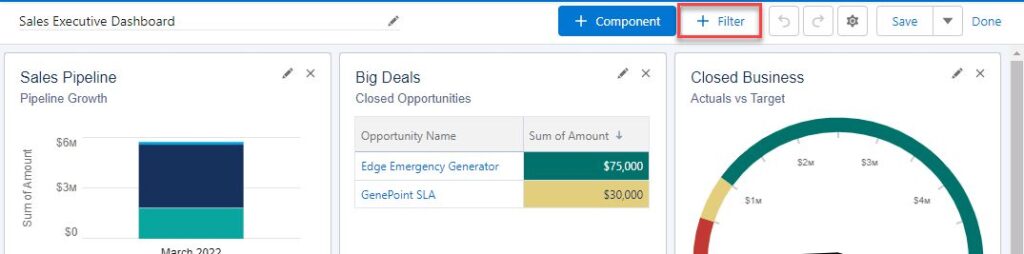
1. Navigate to a dashboard.
2. Click Edit.
3. Click ➕ Filter
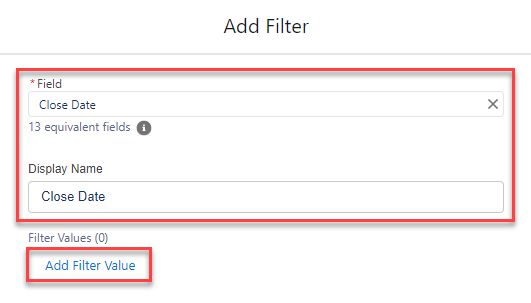
4. Select a Field.
- Optionally, change the Display Name.
5. Click Add Filter Value.
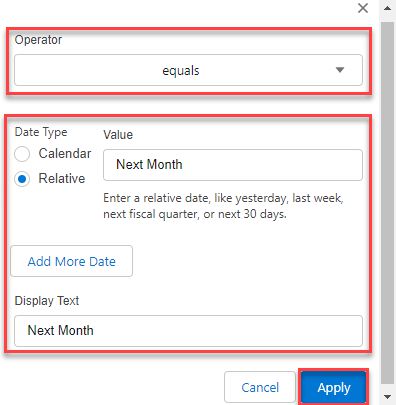
6. Select the Operator.
7. Choose the Values.
- Select individual values or combine them.
- Value options change depending on the field type.
- Optionally, change the Display Text.
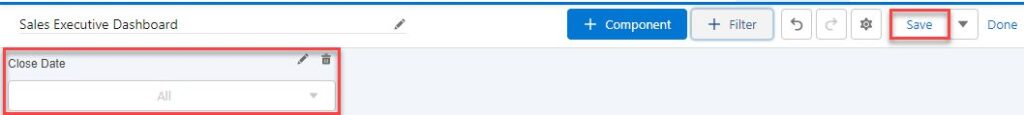
8. Click Apply.
9. Click Add.
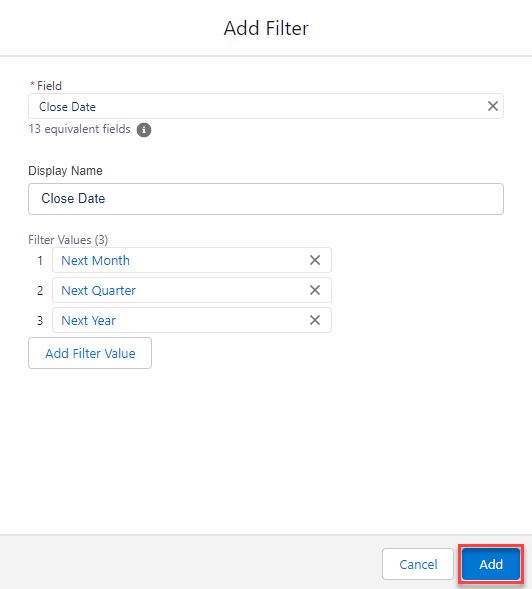
10. Click Save
Edit a Filter
1. Navigate to a Dashboard.
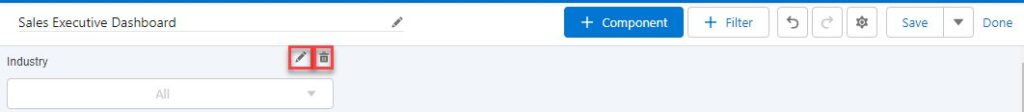
2. Click Edit.
3. Click the ✏️ icon to Edit the Filter.
4. Click the 🗑 icon to Delete the Filter.
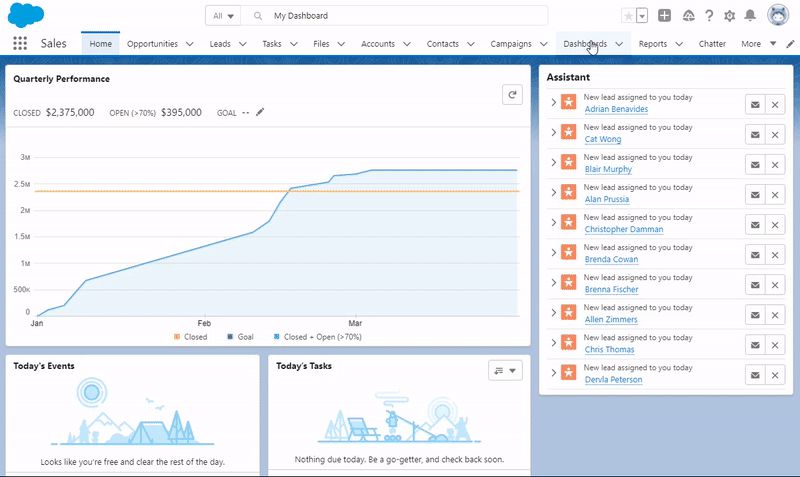
4. Dashboard Folders in Salesforce Lightning
Dashboard Folders allow you to organize your Dashboards into different categories.
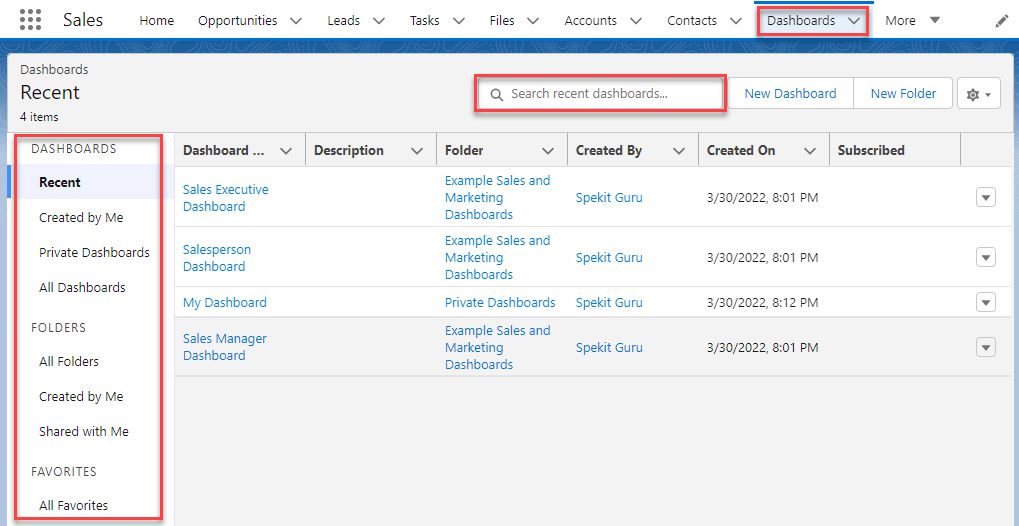
When you click the Dashboard tab it defaults to the Recent Dashboards list
- You can search for existing Dashboards using the search bar at top
- Searching for Dashboards will help save time since you won’t need to create one from scratch
- Search for a keyword to narrow your results
- For example, “Cases” if you are looking for a Dashboard that references Cases.
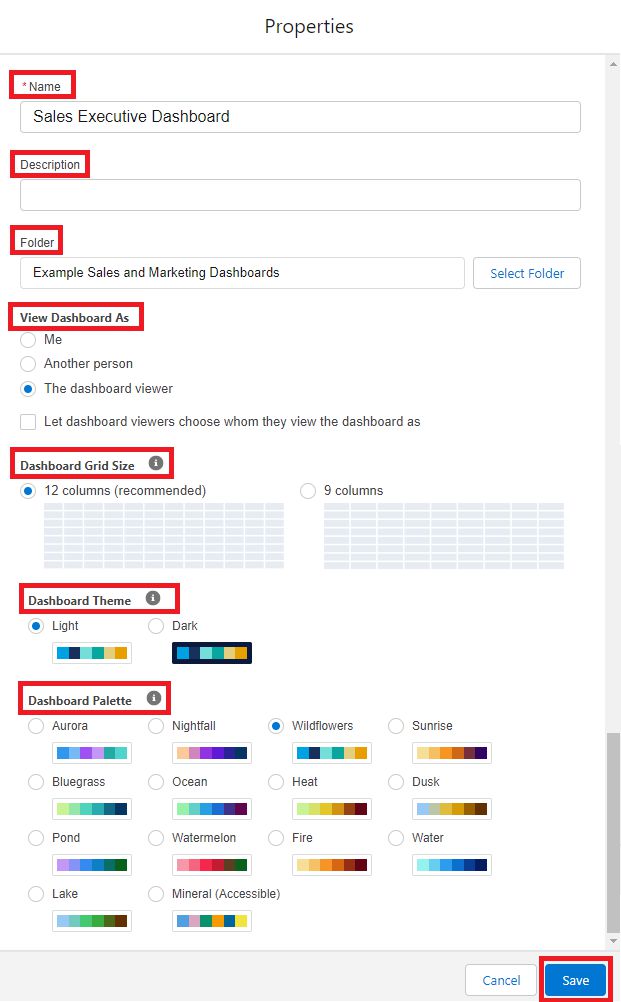
5. Dashboard Properties in Salesforce Lightning
Change underlying Dashboard Settings:
- Name
- Folder
- Light or dark mode
- Color palette of chart colors
1. Navigate to a Dashboard.
2. Click Edit.
3. Click Edit Dashboard Properties.
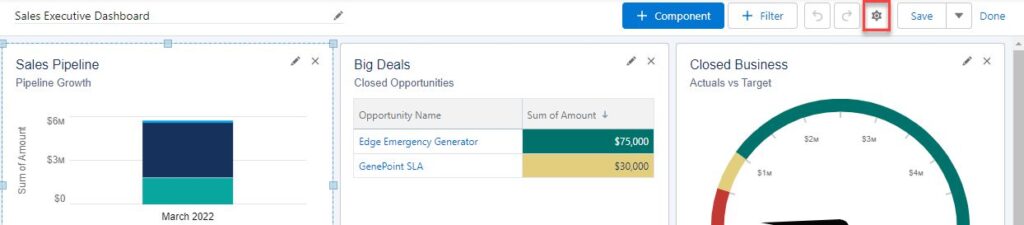
4. Make edits:
5. Click Save.
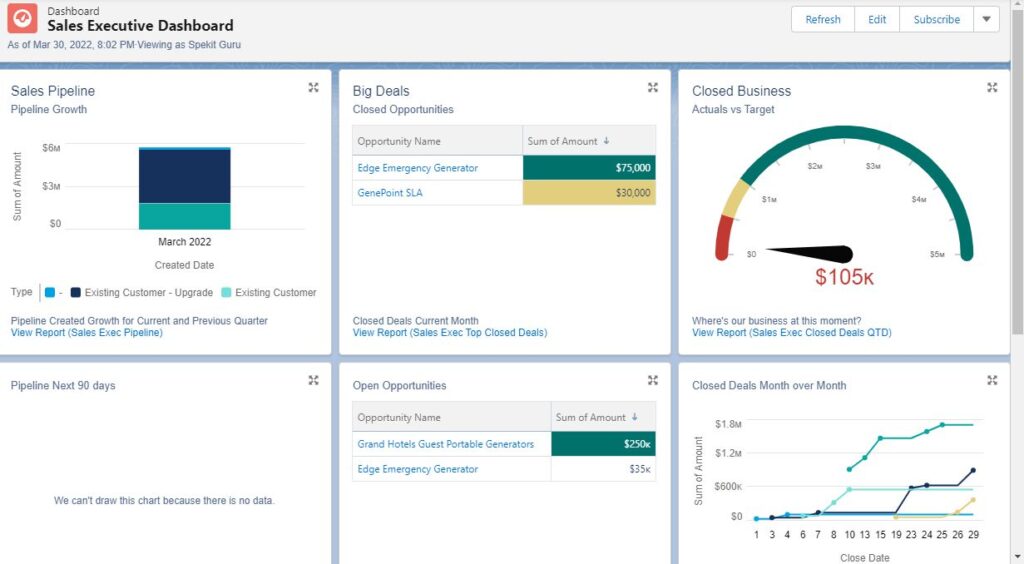
6. Dashboards in Salesforce Lightning
Dashboards are collections of report charts to give a visual picture of a certain topic. Dashboards usually display similar information with different criteria.
For instance:
Dashboards for Opportunities might include:
- Pipeline to Close in the Next 90 Days
- Renewals Remaining to Close This Quarter
- New Logos Won This Year
- New Business ARR This Year Compared to Goal
- Expansion ARR This Year Compared to Goal
- Churn This Year Compared to Goal
Dashboards for Cases might include:
- Cases Opened by Month
- Cases Closed by Month
- Cases in Queue
- Cases by Stage
- Average Time to Close by Case Priority
- Cases Per Rep
7. How to Create a Dashboard in Salesforce Lightning
1. Click the Dashboards tab
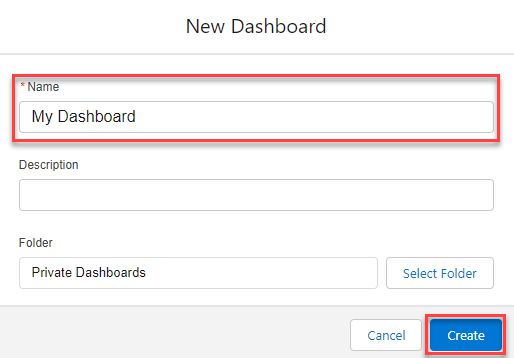
2. Click New Dashboard
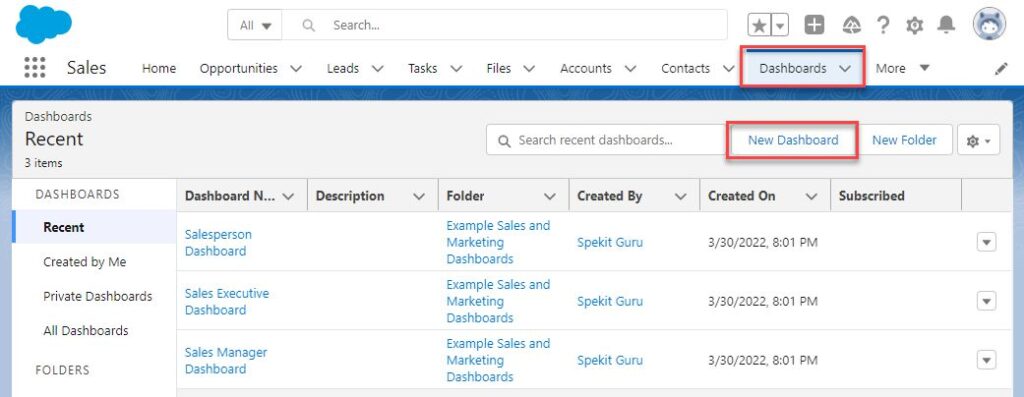
3. Enter the Dashboard Name.
4. Choose to save it to a different, public folder.
5. Click Create.
6. You’ve created the shell, now, make it actionable by searching 🔍 for the following keywords to learn more:
- Dashboard Components
- Dashboard Filters
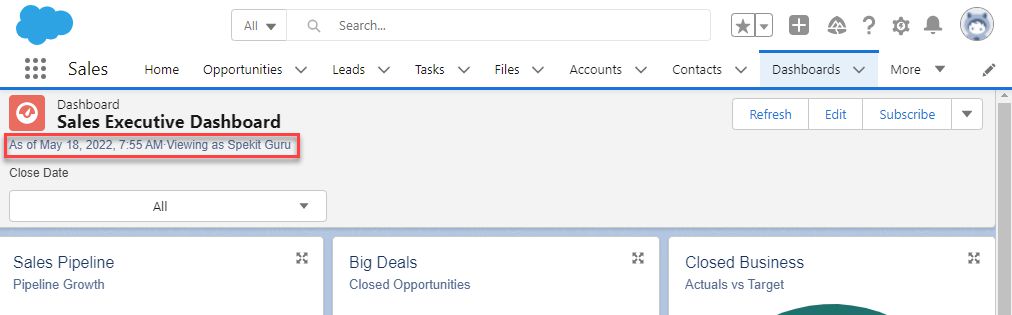
8. Refreshing a Dashboard in Salesforce Lightning
Dashboards are not automatically refreshed each time they are opened, so be sure to review the date it was last refreshed to ensure you are looking at up-to-date metrics.
1. Navigate to a Dashboard
2. See that there is a warning of “Last refreshed X days ago. Refresh this dashboard to see the latest data.”
You can search 🔍 for existing Reports using the search bar at the top
3. Click Refresh
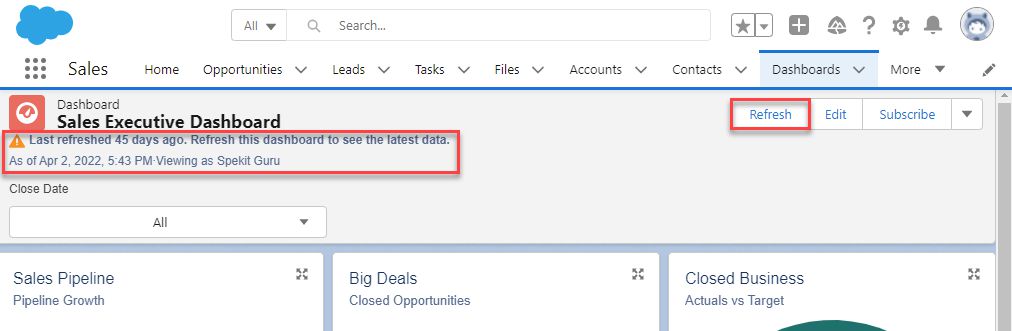
4. See the Dashboard data update and the warning disappear.